Liquidity, Leverage, Liquidation: A Post-Crash Playbook for Delta-Neutral Traders.
Learn how delta-neutral traders navigate liquidity, leverage, and liquidation cycles — and how BTX helps automate the discipline that keeps you in the game.
TL;DR:
When crypto crashes, the headlines focus on price. Professionals focus on structure. This post-crash playbook breaks down the real mechanics behind the $19B liquidation cascade, and what smart traders do in its aftermath. From the reflexive build-up of leverage to the liquidity drought that follows, it’s a masterclass in reading the market’s rhythm rather than reacting to it. You’ll learn how delta-neutral traders interpret funding resets, size positions through chaos, and use tools like BTX to automate precision while others panic.
Because in markets like this, the edge isn’t prediction... it’s endurance.
1) The Market Never “Crashes”... It Resets
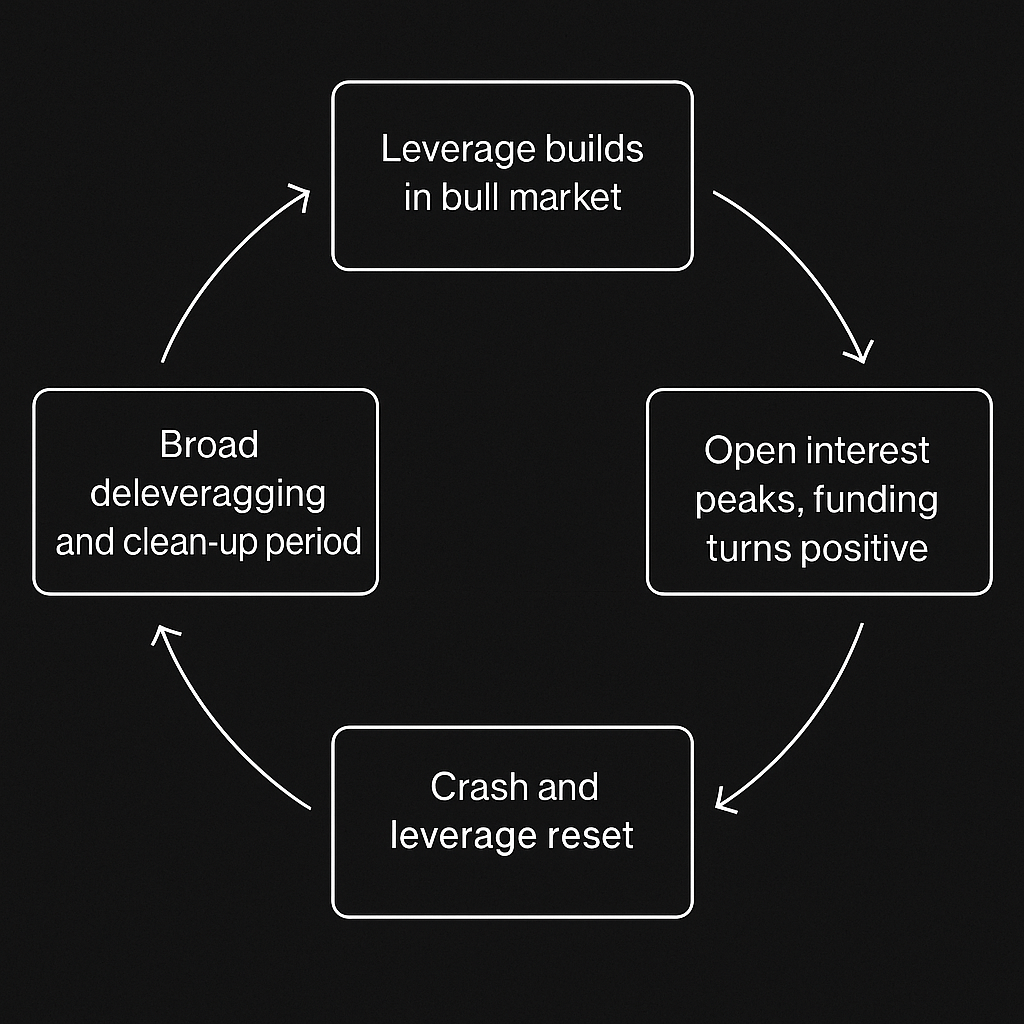
Every violent drawdown looks singular when you’re living through it. In real time, the candles feel unprecedented, the headlines feel decisive, and the liquidation numbers feel apocalyptic. Step back, and a pattern emerges: crypto doesn’t “crash” so much as it resets. Leverage builds quietly in the background, market depth thins at the margins, and a modest external shock exposes a structure that was already unbalanced.
The tinderbox forms in two places. First, open interest swells faster than underlying liquidity. New participants pile into perpetual futures because they’re capital-efficient, and as prices grind higher, they add size rather than take profit. You can see it on any dashboard: OI trends up while top-of-book depth (the real capacity to absorb orders without moving price) doesn’t keep pace. Second, funding stays persistently positive. That’s not a crime; it’s a signal. Persistent positive funding says the market is paying longs to hold the consensus view. When that persists, it attracts carry traders who are long perps for the yield and hedged spot—or worse, unhedged directional longs who believe the yield is a perk on top of a rising market. In both cases, positioning becomes crowded on one side of the boat.
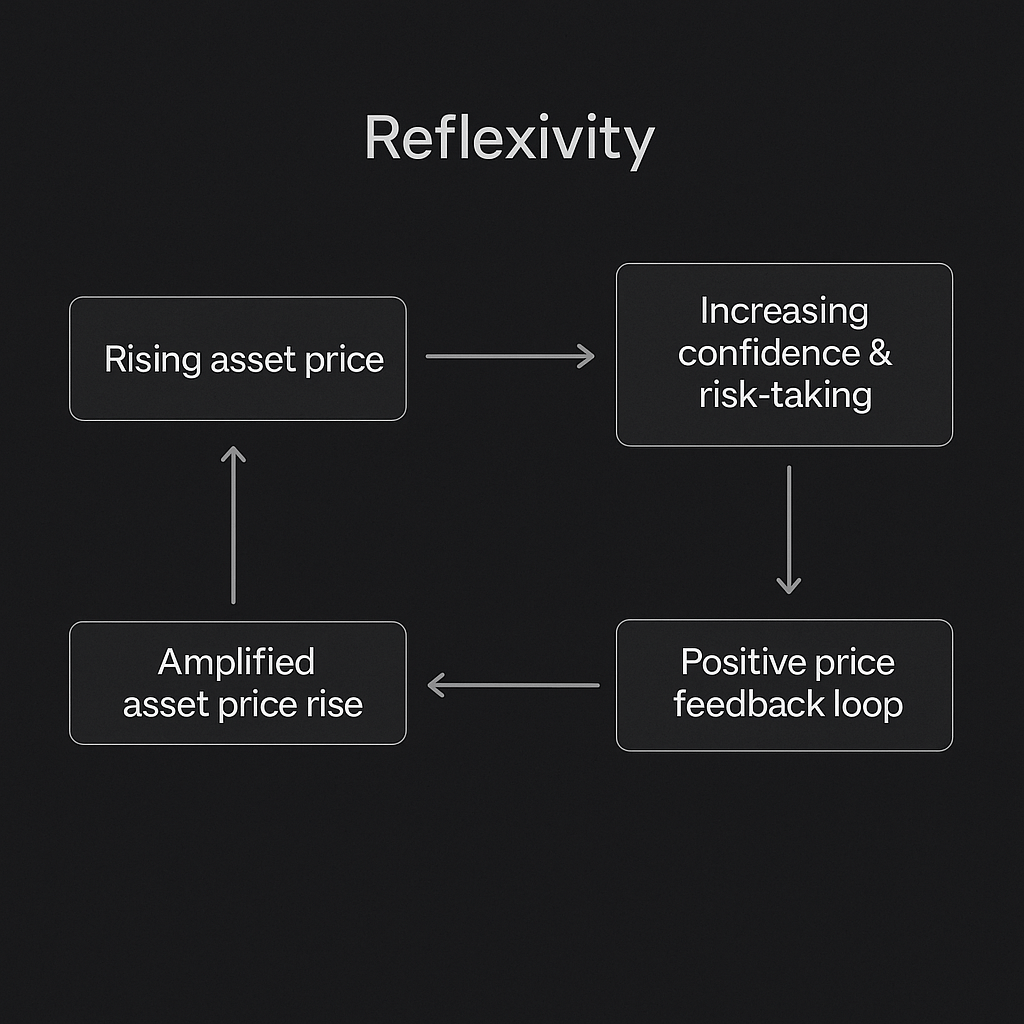
This is where crypto’s reflexivity shows up. Reflexivity means prices and positioning feed each other in a loop. Rising prices invite more leverage; more leverage reduces available liquidity (because it concentrates risk and tightens risk limits), which makes the next price move sharper; the sharper move convinces more participants the trend is “safe,” which pulls in still more leverage. The loop runs until a catalyst—macro headline, exchange outage, a depeg on a single venue, anything that forces rapid balance-sheet adjustment—breaks it. Then the loop runs in reverse. Lower prices reduce collateral value, which triggers margin calls and forced selling, which lowers prices again. Funding collapses or flips; crowded longs scramble to unwind; liquidations beget liquidations.
When the dust settles, what changed is not only price but structure. Positioning is lighter. The weakest hands are out. Funding is closer to neutral. Basis relationships have moved. In other words, the market has repriced risk. For operators, that’s the moment to shift mindset from prediction (“Where will BTC be tomorrow?”) to calibration (“Given this new structure, how should size, venues, and strategies adjust?”). The reset is not the end of a story; it’s the start of the next configuration.
2) Leverage as a Cycle, Not a Sin
Leverage is neither moral nor immoral; it is cyclical. In bull phases, the rhythm is familiar. Trend strength compresses realized volatility, funding stays positive, and spreads tighten as market makers compete for flow. Lower observed volatility makes levered positions appear safer in risk models, which encourages brokers and exchanges to offer more buying power. Traders then size up because “the same position” seems to carry less risk. Price rises, P&L prints, confidence grows. The system becomes more efficient at accommodating the prevailing view—right up until it isn’t.
Every cycle also contains its purge. A shock—macro, microstructure, or venue-specific—hits just as risk budgets are near the top of their range. Value-at-Risk and stress testing flip from permissive to restrictive, margin requirements ratchet higher, and prime brokers cut lines. Market makers, suddenly long inventory into a falling market, widen spreads and reduce posted size to protect balance sheets. Liquidity, which looked abundant, reveals itself as conditional: it’s there until you need all of it at once.
Then comes the rebuild. After the cascade, participants delever and re-underwrite risk. Funding normalizes; OI contracts to a sustainable base; market makers gradually tighten spreads as realized volatility recedes. The market reopens for business, but with different parameters: haircuts are higher, cross-margin rules are stricter, and traders who remain are more selective. Over time, as memory fades and consistency returns, leverage expands again—usually first in the highest-liquidity pairs, then further out the risk curve. The cycle restarts.
Understanding this rhythm is what it means to read the liquidity cycle. You don’t fight it; you align with it. When leverage is expanding and depth is improving, you can justify larger gross exposure with conservative net risk. When leverage is peaking and depth is overstated, you reduce bite size, tighten venue selection, and prioritize execution quality over theoretical edge. The point isn’t to avoid leverage forever; it’s to time its use so you are a liquidity provider when others are price-takers—and a price-taker only when liquidity is genuinely available. That’s how professionals survive multiple cycles with their capital—and confidence—intact.
3) The Aftershock Phase
The minutes and hours after a liquidation cascade are a different market entirely. Prices may bounce quickly, but liquidity does not. Market makers who took inventory into the fall (or who were forced to hedge into illiquidity) immediately move to protect capital: they widen spreads, pull resting size, and reduce the number of symbols they quote. On the risk side, internal models—calibrated to the fresh spike in realized volatility—cut inventory limits and raise hedging thresholds. The visible effect for traders is twofold: worse fills for the same notional size, and greater slippage around any market or poorly sliced limit order.
At the same time, funding resets—often violently. Here’s why: forced closures disproportionately hit the crowded side of the trade. If longs were crowded into perps, their liquidations both push price lower and mechanically reduce the pool of longs paying funding. As that long cohort shrinks (and shorts expand or cover opportunistically), funding collapses toward zero or even flips negative. The mechanism that had been subsidizing longs evaporates just when many of those longs still want to hang on. If the cascade spilled across multiple venues, you also get short windows where the sign and magnitude of funding differ by exchange, inviting relative-value trades—but with execution risk that is materially higher than it was a week earlier.
This ushers in what professionals think of as the clean-up period. It’s not calm; it’s careful. Order books look patched together. Cross-venue prices can desynchronize by small, fleeting amounts as connectivity and inventory constraints normalize. Borrow availability tightens temporarily, lending rates reprice, and haircuts on riskier collateral tick up. Retail flows slow down; some systematic strategies go offline to avoid trading into bad marks; and headline-driven whipsaws persist as surviving shorts and bottom-fishers test each other.
Trading this environment feels like walking across a river on stepping stones: it’s possible, but you must place each foot deliberately. The opportunity is real precisely because pricing becomes inefficient. Basis can widen relative to recent norms; funding differentials across exchanges and pairs can appear and disappear; term structure can kink in ways that reward neutrality over direction. But the edge is collected on entry and scaling, not by swinging for home runs. This is when execution matters more than thesis.
What does “smart capital” do in the aftershock?
- Start smaller, scale slower. Instead of deploying a full target size at once, operators initiate with a fraction and use measured Increase actions only if funding, depth, and spreads remain supportive.
- Prefer depth over headline APR. BTC/ETH pairs with thick books and consistent matching engines are safer for redeployment than thin alt pairs offering seductive yields.
- Watch structure, not price. Focus on the direction of funding (is it stabilizing?), OI relative to volume (is leverage creeping back responsibly?), and book depth at multiple levels (is liquidity refilling or still retreating?).
- Respect venue risk. If a specific exchange or account system contributed to the cascade, treat its metrics with extra skepticism until collateral valuation, oracle usage, and liquidation logic are clarified.
The clean-up phase ends not when price recovers a percentage, but when microstructure normalizes: spreads tighten, resting size returns, cross-venue basis compresses, and funding behaves consistently across time windows. Only then do professionals raise gross exposures toward pre-shock levels. Until that point, survival and precision outrank speed. The traders who last the longest aren’t the fastest movers after a crash; they’re the ones who know exactly how to move when the market is still stitching itself back together.
4) How Delta-Neutral Traders Read This Environment
For traders running delta-neutral strategies, a post-crash market is less a battlefield and more a laboratory. The chaos of directional trading gives way to what professionals recognize as signal clarity. Prices are no longer simply moving — they are revealing structure.
When the tide of leverage recedes, it exposes the mechanics underneath: who was over-extended, which venues handled stress cleanly, and where liquidity now resides. The job of the delta-neutral operator is to read these structural clues, not to predict price direction but to understand where inefficiencies now exist and how to safely capture them.
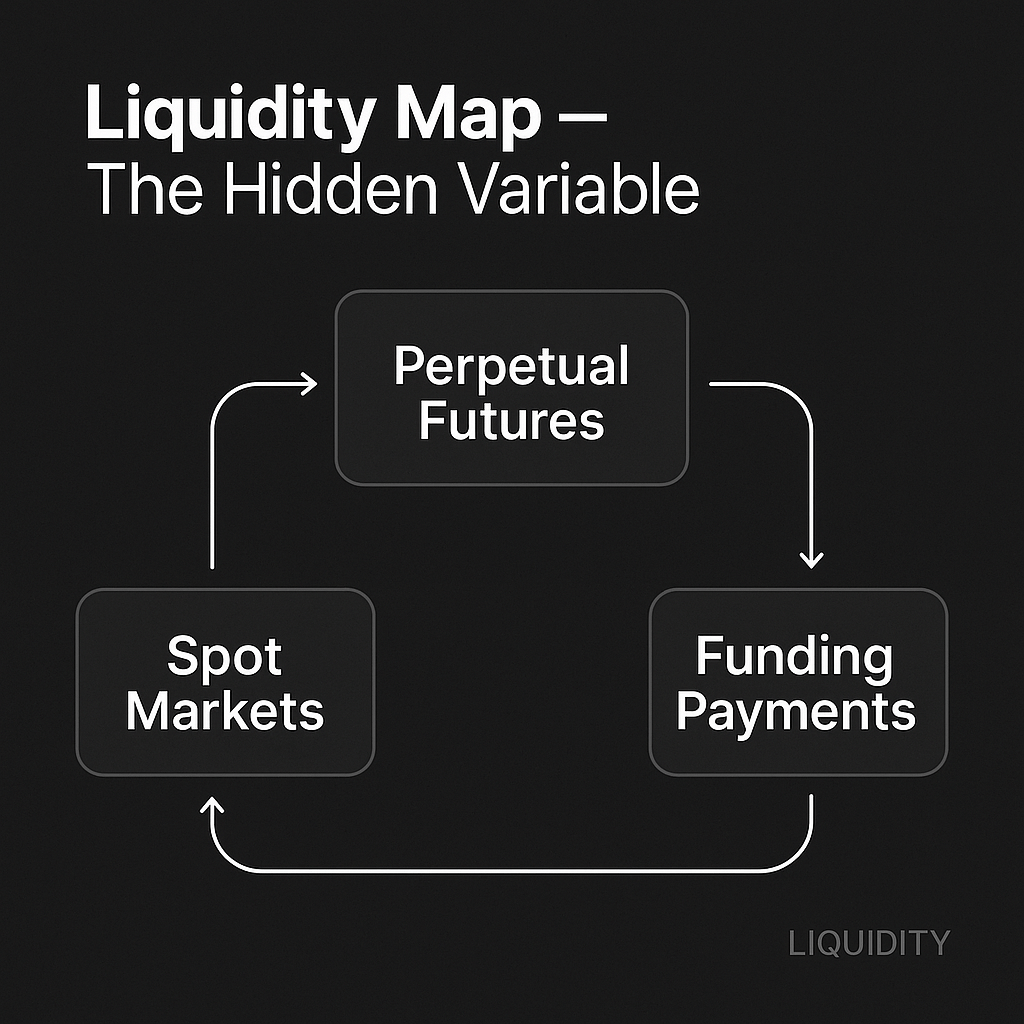
The first clue comes from funding rates. Funding is the heartbeat of the perpetual market — the small recurring payment that keeps perpetual futures tethered to the spot price. When funding goes sharply negative after a cascade, it signals that traders are paying to hold shorts. Historically, that’s when the basis (the spread between spot and perp) becomes most attractive to trade, because fear has replaced greed. But funding alone is not a signal to deploy; it’s a signal to observe. You must ask: is negative funding caused by panic, or by a real shift in structural positioning?
Next comes open interest versus realized volatility. If open interest begins climbing while realized volatility remains low, leverage is returning to the system. That can be bullish or bearish depending on the direction of funding, but for neutral traders it means one thing: spreads are beginning to normalize. Stable volatility enables market makers and delta-neutral desks to quote tighter and execute larger. That’s when opportunities for basis capture — long spot/short perp or the reverse — start to reappear with manageable risk.
Then there’s cross-venue dislocation. After major shocks, exchanges rarely move back in sync immediately. One venue might still have a negative funding imbalance, another might show delayed index pricing or mismatched insurance fund behavior. These inconsistencies are temporary, but they’re gold for neutral strategies. A trader running automation across multiple exchanges can arbitrage funding flows or relative basis levels while keeping overall delta flat.
Finally, liquidity depth becomes the practical constraint. A post-crash market often looks wide and thin: prices may seem stable, but the true executable size without moving the book is smaller than normal. Manual traders misjudge this constantly. Professionals rely on tooling that visualizes depth dynamically and adjusts order slicing in real time. BTX, for example, treats liquidity as a parameter — not an assumption — letting traders deploy in measured increments rather than “crossing” the book into thin air.
The takeaway is simple: after a crash, the delta-neutral trader is not chasing a rebound. They are assessing which inefficiencies are now tradable at acceptable risk. That requires patience, situational awareness, and automation capable of reacting faster than human reflexes. In the calm that follows chaos, precision becomes the only edge that matters.
5) The Discipline of Position Sizing
In theory, risk management is simple: never size positions so large they can kill you. In practice, greed and overconfidence make that lesson expensive to learn. The difference between a professional and an amateur is rarely the strategy — it’s the discipline of how much they put on.
After every crash, there’s a pattern. The traders who disappear were almost never wrong about direction. They were wrong about magnitude. They ran five times the leverage they should have, scaled too fast, or failed to keep enough margin buffer when volatility exploded. The market didn’t need to move against them by much; it simply needed to move quickly.
Professionals think in risk units, not conviction. They define exposure based on volatility, liquidity, and time horizon, not gut feel. In delta-neutral trading, that means sizing basis trades so that the combined mark-to-market swing between spot and perpetual legs cannot trigger forced liquidation before the position’s intended unwind. That’s not about “being safe” — it’s about staying solvent long enough for the strategy’s edge to manifest.
One way to visualize it is as a capital pyramid:
- The base is reserve capital, untouchable.
- The middle is operational capital, deployed across multiple delta-neutral trades.
- The apex is risk capital, small tactical allocations for opportunistic spreads.
The higher you go up that pyramid, the faster capital should recycle and the stricter your drawdown limits must be. Most traders invert this structure — they overcommit to the riskiest layer and starve their reserves. That’s why they vanish when markets turn.
Another overlooked aspect is margin concentration. Using a single exchange for all positions introduces correlated liquidation risk — not because of market moves, but because of exchange-side mechanics: oracle delays, collateral valuation quirks, or server outages. Professionals distribute margin and exposures across venues precisely so that one technical failure cannot trigger cascading liquidations.
In delta-neutral systems like BTX, margin and size are monitored holistically. Instead of thinking “five trades, five risks,” you think in portfolio delta and aggregate margin ratio. This mindset mirrors institutional prime brokerage: measure total exposure, stress it, and trim before it trims you.
The irony is that position sizing isn’t glamorous — it’s invisible. There’s no leaderboard for restraint, no screenshot for avoided losses. But this is what separates operators from gamblers. In the long run, the winners are not those who capture the highest yields; they’re the ones who remain liquid long enough to keep compounding them.
6) Liquidity: The Invisible Variable
Every trader talks about liquidity; few actually measure it. Liquidity is often treated as an abstract comfort — “Bitcoin’s liquid, I can get out anytime.” That illusion holds until it doesn’t. True liquidity is not the number of tokens traded per day; it’s the depth available at the price you need, in the moment you need it.
After a crash, that depth collapses. Market makers widen spreads or temporarily pull quotes to control inventory. Algorithmic liquidity providers reduce resting size because their volatility filters trip; they’ll return once spreads stabilize. For large accounts, this means every click carries hidden cost: impact slippage, delayed fills, and exposure to adverse selection.
The challenge for delta-neutral traders is that most of their profits come from small spreads repeated at scale. When liquidity is impaired, execution cost can erase that edge. A 10-basis-point funding capture looks compelling until you give back eight of them in slippage. That’s why post-crash markets test not just your strategy, but your execution infrastructure.
Professional operators approach liquidity as a living input, not a constant. They quantify it — book depth by level, average fill latency, quote stability over rolling intervals — and feed it into their sizing and scaling models. In delta-neutral frameworks like BTX, order routing algorithms adapt in real time: if a book thins out, order slices shrink automatically; if spreads tighten, position entries accelerate. The system optimizes for cost-adjusted yield, not headline APR.
But liquidity isn’t just mechanical; it’s psychological. After large crashes, human traders collectively hesitate. That hesitation becomes self-reinforcing: less displayed size begets less confidence, which keeps liquidity thin. Ironically, the few players willing to quote consistently in this period often earn outsized returns precisely because everyone else is waiting for “confirmation.” This is why institutional desks quietly rebuild positions when public sentiment is still fearful. They understand that the reward is not for predicting the rebound, but for providing liquidity while others retreat.
There’s also a crucial temporal element. Liquidity cycles through sessions. In crypto, depth improves during U.S. and Asian trading hours and deteriorates during weekends — especially post-shock. Understanding when to enter is as critical as knowing what to enter. Delta-neutral execution systems handle this programmatically: avoiding low-liquidity windows and scaling exposure during optimal volume clusters.
In essence, liquidity is the invisible variable that defines the true risk of any trade. It determines not only how easily you can enter or exit, but how your P&L behaves under stress. The best operators don’t chase liquidity; they anticipate its rhythm and build their process around it. In a world where slippage kills more P&L than bad ideas, mastering liquidity is not optional — it’s survival.
7) Leverage Rebuilds — But Differently
Every crash teaches the same lesson in a slightly different dialect. When the market stabilizes, leverage always returns — but not in the same form that preceded the collapse. The composition changes. The players change. The intent behind leverage changes.
The first wave back is usually mechanical. Market makers resume quoting deeper books, derivatives desks reintroduce inventory, and automated systems recalibrate margin parameters based on new volatility norms. This is healthy leverage — functional leverage. It exists to restore liquidity and facilitate trading, not to chase performance.
Then comes the second wave: structured leverage. Institutions, funds, and systematic traders begin rebuilding positions, but this time within risk frameworks hardened by the crash. They use cleaner collateral, stricter cross-margining, and tighter execution automation. Instead of YOLO long perps at 20× leverage, they reintroduce balanced positions — long spot, short perps, or cross-exchange hedges. In other words, leverage becomes informational again: a tool for expressing precision, not ego.
Finally, months later, the speculative wave returns. Retail volume picks up, meme coins start trending again, and funding begins to skew positive for too long. That’s when professionals start trimming size and rebalancing collateral, because they’ve seen the pattern before. It’s not cynicism; it’s cycle literacy.
The broader story is that leverage evolves. Every cycle, it migrates toward smarter architecture — and automation accelerates that evolution. Tools like BTX aren’t designed to eliminate leverage but to enforce discipline around it: predefined sizing, execution algorithms that minimize slippage, and risk dashboards that make margin visible across venues. When leverage returns — and it always does — these systems determine who profits from it and who gets crushed by it.
The pros understand that leverage is not the problem; opacity is. When you can see your exposures clearly, you control leverage. When you can’t, it controls you. The lesson of every liquidation cascade isn’t “leverage bad” — it’s “visibility saves.” And visibility is what separates survivors from statistics.
8) What the Pros Are Doing Now
While retail traders wait for “confirmation,” professionals are already operating — quietly, selectively, and systematically. Their focus isn’t on predicting the next move; it’s on observing how the market is digesting the last one.
In post-crash conditions, pros watch four key structural signals:
- Funding Rate Directionality.
Funding is the pulse of market sentiment. Sustained negative funding after a crash means shorts are paying longs — fear is still in control. When that fear persists even as price stabilizes, it suggests there’s dry powder waiting to redeploy. The flip from negative to neutral is often the first sign of structural balance returning. - Open Interest vs. Realized Volatility.
Rising OI alongside falling realized volatility means confidence is rebuilding. Traders are adding exposure, but not recklessly — positions are growing under controlled conditions. Conversely, rising OI and rising volatility suggest overextension is already underway again, warning professionals to stay small. - Basis and Spread Behavior.
Professionals map the relationship between spot and perps across multiple venues. When spreads are wide and inconsistent, inefficiency is high — ideal for delta-neutral execution. When spreads compress too quickly, the easy edge disappears, signaling that the next phase of the cycle (speculative compression) is beginning. - Liquidity Reaccumulation.
This is the tell that matters most. Professionals don’t deploy based on headlines; they deploy based on book depth. When liquidity across exchanges rebuilds consistently — measured in executable size, not nominal volume — the market is ready for scaled strategies again.
At a behavioral level, pros operate differently from the crowd in this phase. They don’t rush back in with size; they test the market with small tranches, measure slippage, and let their systems gather real-time data on execution quality. Their goal is to determine not whether “the bottom is in,” but whether the microstructure is healthy enough to support their strategies.
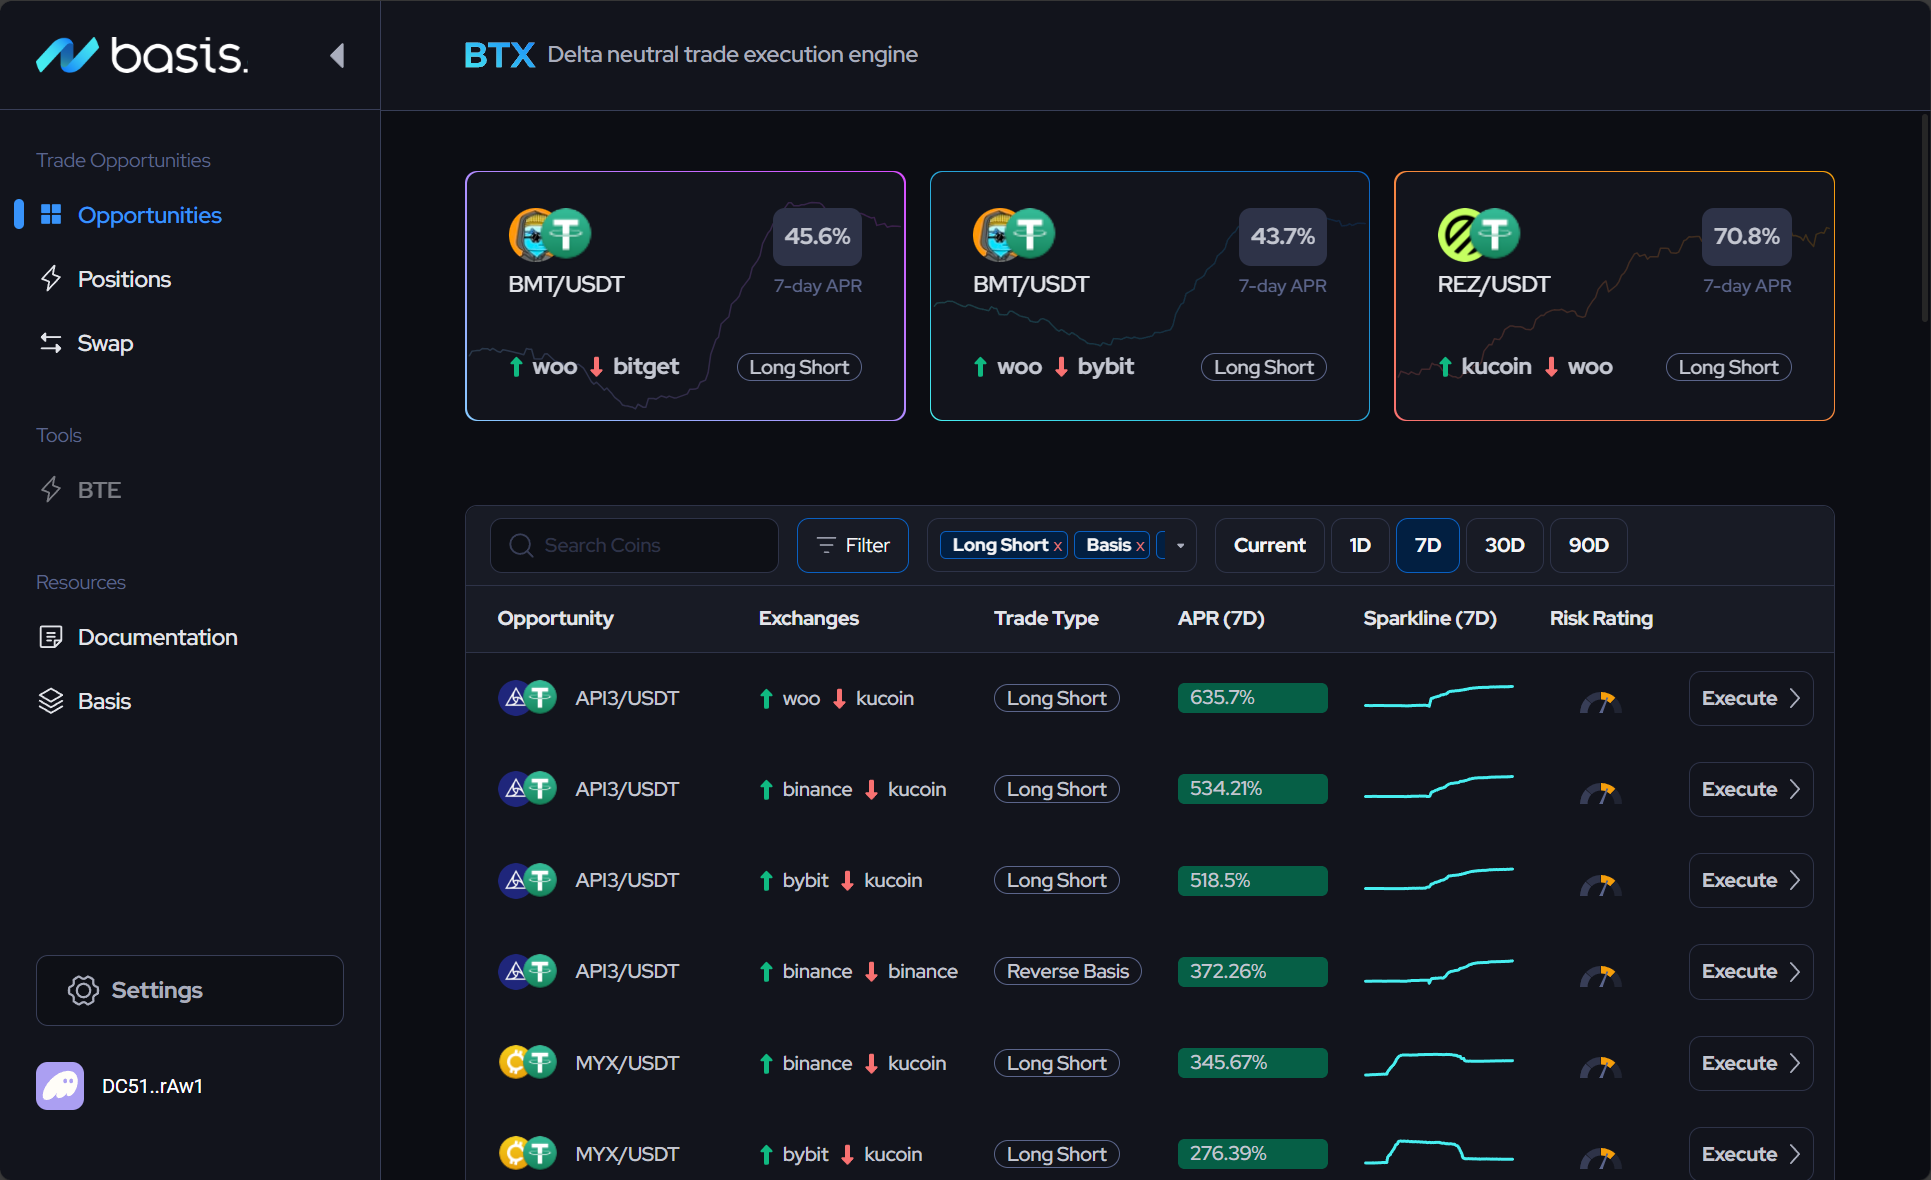
In this sense, BTX acts less like a trading platform and more like mission control. It gives traders a unified lens over multiple venues, aggregating funding, margin, and execution quality into a single dashboard. In a world where milliseconds and mispricing determine profitability, visibility becomes alpha.
While the retail crowd still debates price targets, professionals are building structure. They’re reallocating margin, rebalancing collateral, calibrating risk models, and automating execution. This isn’t about prediction — it’s about posture. And posture, not opinion, determines who profits from the next cycle.
9) The Calm After the Liquidation
Every crash ends the same way — not with a bang, but with silence. Activity dries up, volatility collapses, and traders stare at charts waiting for a new narrative. This quiet is deceptive. It feels safe, but it’s actually where the most important work happens.
In the calm, pricing inefficiencies persist, but they’re harder to see because movement slows. Funding rates normalize, OI stabilizes, and volume compresses into predictable bands. For directional traders, this is purgatory. For delta-neutral operators, it’s paradise. The noise is gone. What remains is a clean environment for structural trades that rely on consistency, not conviction.
This phase rewards precision over aggression. The best trades now are not those chasing rebounds, but those exploiting dislocations that haven’t yet fully closed — small but steady basis trades, misaligned funding pairs, or multi-exchange arbitrage gaps left behind by retreating liquidity providers.
The most disciplined operators use this period to stress test their systems. They refine execution logic, optimize routing between venues, and simulate what would happen if volatility spikes again. It’s preparation masquerading as quiet time.
Philosophically, this is where the professional mindset diverges from the crowd. The crowd sees calm as boring. Pros see it as the dividend of discipline — the time to reprice risk, clean the balance sheet, and position for the next build-up. The calm after a liquidation is not a lull; it’s the reset state where new edge compounds silently.
If the crash was the market’s purge, this is its therapy. The system breathes, resets, and forgets. And then, inevitably, the cycle begins again.
10) Conclusion: Repricing Risk Is the Real Edge
When traders talk about “edge,” they usually mean insight — knowing something others don’t. But in markets like crypto, the true edge is endurance. It’s the ability to survive through the full arc of leverage — build-up, collapse, and recovery — while others burn out along the way.
The October crash didn’t reveal anything new; it just reminded everyone of what professionals already know.
Risk doesn’t disappear in bull markets. It simply changes form. It migrates from price risk to leverage risk, from volatility to liquidity, from ignorance to overconfidence. The traders who last are those who continuously reprice it — not emotionally, but structurally.
That’s the ethos behind BTX (Basis Trade eXecutor). It’s not a casino tool; it’s infrastructure for the professionals who treat delta-neutral trading as a craft. Automated execution isn’t about chasing every opportunity; it’s about surviving long enough to capture the right ones. The platform doesn’t predict the next move — it keeps traders stable while the world around them panics.
In the long run, every market cycle rewards the same qualities: patience, clarity, and discipline. The pros don’t win because they’re smarter. They win because they stay organized when everyone else gets emotional.
When the market crashes, most traders react. Professionals don’t.
They observe. They adapt. They reprice risk... and keep compounding.
Join the community at discord.basis.markets and check out how other users are taking advantage of the BTX to survive and thrive the ups and downs of the market.